Tuning an application involves determining the source of performance problems and then rectifying those problems to make your programs run their fastest on the available hardware. Performance gains usually fall into one of three categories of measured time:
User CPU time: time accumulated by a user process when it is attached to a CPU and is executing.
Elapsed (wall-clock) time: the amount of time that passes between the start and the termination of a process.
System time: the amount of time performing kernel functions like system calls, sched_yield, for example, or floating point errors.
Any application tuning process involves the following steps:
Analyzing and identifying a problem
Locating where in the code the problem is
Applying an optimization technique
This chapter describes the process of analyzing your code to determine performance bottlenecks. See Chapter 6, “Performance Tuning”, for details about tuning your application for a single processor system and then tuning it for parallel processing.
One of the first steps in application tuning is to determine the details of the system that you are running. Depending on your system configuration, different options may or may not provide good results.
The topology(1) command displays general information about SGI Altix systems, with a focus on node information. This includes node counts for blades, node IDs, NASIDs, memory per node, system serial number, partition number, UV Hub versions, CPU to node mappings, and general CPU information. Example output is, as follows:
uv44-sys:~ # topology
Serial number: UV-00000044
Partition number: 0
4 Blades
64 CPUs
125.97 Gb Memory Total

Blade         ID       asic  NASID         Memory
-------------------------------------------------
    0 r001i01b00  UVHub 2.0      0    16757488 kB
    1 r001i01b01  UVHub 2.0      2    16777216 kB
    2 r001i01b02  UVHub 2.0      4    16777216 kB
    3 r001i01b03  UVHub 2.0      6    16760832 kB

CPU      Blade PhysID CoreID APIC-ID Family Model Speed L1(KiB) L2(KiB) L3(KiB)
-------------------------------------------------------------------------------
  0 r001i01b00     00     00       0      6    46  1866 32d/32i     256   18432
  1 r001i01b00     00     03       6      6    46  1866 32d/32i     256   18432
  2 r001i01b00     00     08      16      6    46  1866 32d/32i     256   18432
  3 r001i01b00     00     11      22      6    46  1866 32d/32i     256   18432
  4 r001i01b00     01     00      32      6    46  1866 32d/32i     256   18432
  5 r001i01b00     01     03      38      6    46  1866 32d/32i     256   18432
  6 r001i01b00     01     08      48      6    46  1866 32d/32i     256   18432
  7 r001i01b00     01     11      54      6    46  1866 32d/32i     256   18432
  8 r001i01b01     02     00      64      6    46  1866 32d/32i     256   18432
  9 r001i01b01     02     03      70      6    46  1866 32d/32i     256   18432
 10 r001i01b01     02     08      80      6    46  1866 32d/32i     256   18432
 11 r001i01b01     02     11      86      6    46  1866 32d/32i     256   18432
 12 r001i01b01     03     00      96      6    46  1866 32d/32i     256   18432
 13 r001i01b01     03     03     102      6    46  1866 32d/32i     256   18432
 14 r001i01b01     03     08     112      6    46  1866 32d/32i     256   18432
 15 r001i01b01     03     11     118      6    46  1866 32d/32i     256   18432
 16 r001i01b02     04     00     128      6    46  1866 32d/32i     256   18432
                                  ...
63 r001i01b03 07 11 247 6 46 1866 32d/32i 256 18432 |
The cpumap(1) command displays logical CPUs and shows relationships between them in a human-readable format. Aspects displayed include hyperthread relationships, last level cache sharing, and topological placement. The cpumap command gets its information from /proc/cpuinfo, the /sys/devices/system directory structure, and /proc/sgi_uv/topology .
Example output is, as follows:
uv44-sys:~ # cpumap
Mon Oct 18 13:40:26 CDT 2010
uv44-sys.mycompany.com

This an SGI Altix UV
model name           : Intel(R) Xeon(R) CPU E7520 @ 1.87GHz
Architecture         : x86_64
cpu MHz              : 1866.557
cache size           : 18432 KB (Last Level)

Total Number of Sockets                 : 8
Total Number of Cores                   : 32    (4 per socket)
Hyperthreading                          : ON
Total Number of Physical Processors     : 32
Total Number of Logical Processors      : 64    (2 per Phys Processor)

UV Information
 HUB Version:                            UVHub  2.0
 Number of Hubs (Blades):                4
 Number of connected NUMAlink ports:    12
=============================================================================

Hub-Processor Mapping

  Hub Location      Processor Numbers -- HyperThreads in ()
  --- ----------    ---------------------------------------
    0 r001i01b00       0    1    2    3    4    5    6    7
                  (   32   33   34   35   36   37   38   39 )
    1 r001i01b01       8    9   10   11   12   13   14   15
                  (   40   41   42   43   44   45   46   47 )
    2 r001i01b02      16   17   18   19   20   21   22   23
                  (   48   49   50   51   52   53   54   55 )
    3 r001i01b03      24   25   26   27   28   29   30   31
                  (   56   57   58   59   60   61   62   63 )

=============================================================================

Processor Numbering on Socket(s)

  Socket    (Logical) Processors
  ------    -------------------------
     0      0    1    2    3   32   33   34   35
     1      4    5    6    7   36   37   38   39
     2      8    9   10   11   40   41   42   43
     3     12   13   14   15   44   45   46   47
     4     16   17   18   19   48   49   50   51
     5     20   21   22   23   52   53   54   55
     6     24   25   26   27   56   57   58   59
     7     28   29   30   31   60   61   62   63

=============================================================================

Sharing of Last Level (3) Caches

  Socket    (Logical) Processors
  ------    -------------------------
     0      0    1    2    3   32   33   34   35
     1      4    5    6    7   36   37   38   39
     2      8    9   10   11   40   41   42   43
     3     12   13   14   15   44   45   46   47
     4     16   17   18   19   48   49   50   51
     5     20   21   22   23   52   53   54   55
     6     24   25   26   27   56   57   58   59
     7     28   29   30   31   60   61   62   63

=============================================================================

HyperThreading

  Shared Processors
  -----------------
 (    0,   32) (    1,   33) (    2,   34) (    3,   35)
 (    4,   36) (    5,   37) (    6,   38) (    7,   39)
 (    8,   40) (    9,   41) (   10,   42) (   11,   43)
 (   12,   44) (   13,   45) (   14,   46) (   15,   47)
 (   16,   48) (   17,   49) (   18,   50) (   19,   51)
 (   20,   52) (   21,   53) (   22,   54) (   23,   55)
 (   24,   56) (   25,   57) (   26,   58) (   27,   59)
( 28, 60) ( 29, 61) ( 30, 62) ( 31, 63) |
Use the x86info(1) command to display x86 CPU diagnostics information, as follows:
uv44-sys:~ # x86info
x86info v1.25.  Dave Jones 2001-2009
Feedback to .

Found 64 CPUs
--------------------------------------------------------------------------
CPU #1
EFamily: 0 EModel: 2 Family: 6 Model: 46 Stepping: 6
CPU Model: Unknown model.
Processor name string: Intel(R) Xeon(R) CPU           E7520  @ 1.87GHz
Type: 0 (Original OEM)  Brand: 0 (Unsupported)
Number of cores per physical package=16
Number of logical processors per socket=32
Number of logical processors per core=2
APIC ID: 0x0    Package: 0  Core: 0   SMT ID 0
--------------------------------------------------------------------------
CPU #2
EFamily: 0 EModel: 2 Family: 6 Model: 46 Stepping: 6
CPU Model: Unknown model.
Processor name string: Intel(R) Xeon(R) CPU           E7520  @ 1.87GHz
Type: 0 (Original OEM)  Brand: 0 (Unsupported)
Number of cores per physical package=16
Number of logical processors per socket=32
Number of logical processors per core=2
APIC ID: 0x6    Package: 0  Core: 0   SMT ID 6
--------------------------------------------------------------------------
CPU #3
EFamily: 0 EModel: 2 Family: 6 Model: 46 Stepping: 6
CPU Model: Unknown model.
Processor name string: Intel(R) Xeon(R) CPU           E7520  @ 1.87GHz
Type: 0 (Original OEM)  Brand: 0 (Unsupported)
Number of cores per physical package=16
Number of logical processors per socket=32
Number of logical processors per core=2
APIC ID: 0x10   Package: 0  Core: 0   SMT ID 16
--------------------------------------------------------------------------
... |
You can also use the uname command, which returns the kernel version and other machine information. For example:
uv44-sys:~ # uname -a Linux uv44-sys 2.6.32.13-0.4.1.1559.0.PTF-default #1 SMP 2010-06-15 12:47:25 +0200 x86_64 x86_64 x86_64 GNU/Linux |
For more system information, change directory (cd) to the /sys/devices/system/node/node0/cpu0/cache directory.
For example:
uv44-sys:/sys/devices/system/node/node0/cpu0/cache # ls index0 index1 index2 index3 |
Change directory to index0 and list the contents, as follows:
uv44-sys:/sys/devices/system/node/node0/cpu0/cache/index0 # ls coherency_line_size level number_of_sets physical_line_partition shared_cpu_list shared_cpu_map size type ways_of_associativity |
There are usually three areas of program execution that can have performance slowdowns:
CPU-bound processes: processes that are performing slow operations (such as sqrt or floating-point divides) or non-pipelined operations such as switching between add and multiply operations.
Memory-bound processes: code which uses poor memory strides, occurrences of page thrashing or cache misses, or poor data placement in NUMA systems.
I/O-bound processes: processes which are waiting on synchronous I/O, formatted I/O, or when there is library or system level buffering.
Several profiling tools can help pinpoint where performance slowdowns are occurring. The following sections describe some of these tools.
The perf(1) software provides the performance analysis tools for Linux. Performance counters for Linux are a kernel-based subsystem that provide a framework for all things performance analysis. It covers hardware level CPU/performance monitoring unit (PMU) features and software features, such as, software counters and tracepoints, as well. To use the perf profiling tools, you need to make sure the perf RPM is installed.. For more information, see the following man pages: perf-stat(1), perf-top(1), perf-record (1), perf-report(1), perf-list(1)
“PerfSuite is an easy-to-use collection of tools, utilities, and libraries to support application software performance analysis on Linux-based systems. It includes components to assist with a wide variety of performance-related tasks, ranging from assistance with compiler optimization reports to hardware performance counting, profiling, and MPI usage summarization. PerfSuite is Open Source software, approved for licensing under the University of Illinois/NCSA Open Source License (OSI-approved). You can find out more about PerfSuite at the project web sites, located at: http://perfsuite.ncsa.uiuc.edu/ or http://perfsuite.sourceforge.net/.”
For NCSA specific information about using PerfSuite tools, see http://www.ncsa.illinois.edu/UserInfo/Resources/Software/Tools/PerfSuite/ .
“psrun is a PerfSuite command-line utility that can be used to gather hardware performance information on an unmodified executable. It's a convenient and flexible way to do quick performance monitoring/measurement.” For more information, see http://perfsuite.ncsa.uiuc.edu/psrun/.
The Intel VTune performance analyzer does remote sampling experiments. The VTune data collector runs on the Linux system and an accompanying GUI runs on an IA-32 Windows machine, which is used for analyzing the results. VTune allows you to perform interactive experiments while connected to the host through its GUI. PTU (Performance Tuning Utility) is another tool which requires theIntel VTune license.
For details about using VTune, see the following URL:
The following performance tools also can be of benefit when you are trying to optimize your code:
For details about these products, see the following website:
http://developer.intel.com/software/products/threading
| Note: These products have not been thoroughly tested on SGI systems. SGI takes no responsibility for the correct operation of third party products described or their suitability for any particular purpose. |
Three debuggers are available to help you analyze your code:
gdb: the GNU project debugger. This is useful for debugging programs written in C, C++, and Fortran 95. When compiling with C and C++, include the -g option on the compiler command line to produce the dwarf2 symbols database used by gdb.
When using gdb for Fortran debugging, include the -g and -O0 options. Do not use gdb for Fortran debugging when compiling with -O1 or higher.
The debugger to be used for Fortran 95 codes can be downloaded from http://sourceforge.net/project/showfiles.php?group_id=56720 . (Note that the standard gdb compiler does not support Fortran 95 codes.) To verify that you have the correct version of gdb installed, use the gdb -v command. The output should appear similar to the following:
GNU gdb 5.1.1 FORTRAN95-20020628 (RC1)
Copyright 2002 Free Software Foundation, Inc.
For a complete list of gdb commands, see the gdb user guide online at http://sources.redhat.com/gdb/onlinedocs/gdb_toc.html or use the help option. Note that current instances of gdb do not report ar.ec registers correctly. If you are debugging rotating, register-based, software-pipelined loops at the assembly code level, try using idb instead.
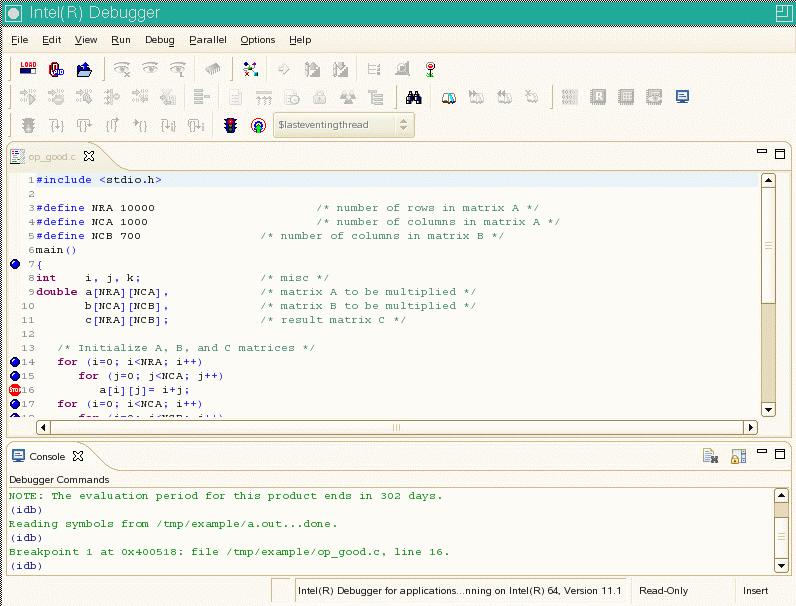
idb: the Intel debugger. This is a fully symbolic debugger for the Linux platform. The debugger provides extensive support for debugging programs written in C, C++, FORTRAN 77, and Fortran 90. idb includes a GUI and it supports both Intel and GNU compilers.
Running idb with the -gdb option on the shell command line provides gdb (1)-like user commands and debugger output.
ddd: a GUI to a command line debugger. It supports gdb and idb. For details about usage, see the following subsection.
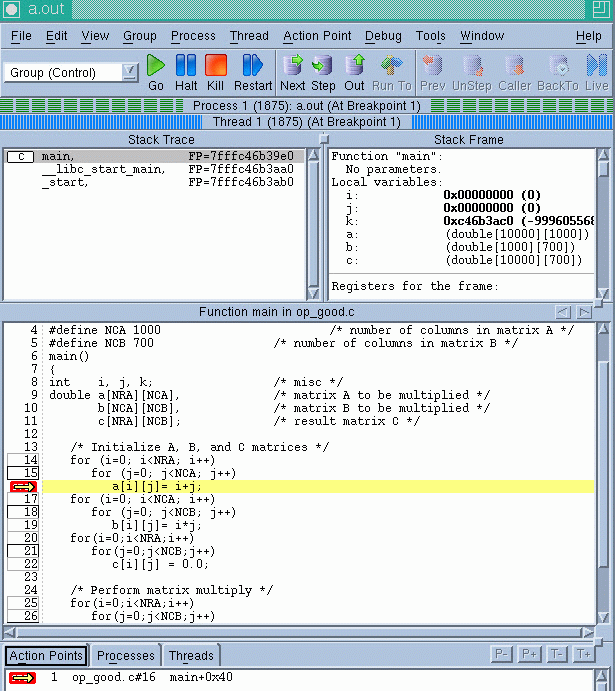
TotalView: a licensed graphical debugger useful in an MPI environment (see http://www.totalviewtech.com/ )
Figure 3-1 shows a TotalView sesssion.
idb is part of the Intel Compiler suite, both Fortran and C/C++. You are asked during the installation if you want to install it or not. When running idb you get the GUI interface. When you invoke the idbc command, you get the command line interface.
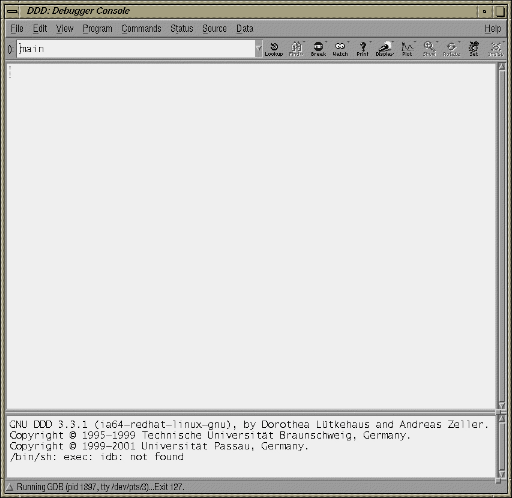
The DataDisplayDebugger ddd(1) tool is a GUI to an arbitrary command line debugger as shown in Figure 3-3. When starting ddd, use the --debugger option to specify the debugger used (for example, --debugger "idb"). The default debugger used is gdb.
When the debugger is loaded the DataDisplayDebugger screen appears divided into panes that show the following information:
Array inspection
Source code
Disassembled code
A command line window to the debugger engine
These panes can be switched on and off from the View menu.
Some commonly used commands can be found on the menus. In addition, the following actions can be useful:
Select an address in the assembly view, click the right mouse button, and select lookup. The gdb command is executed in the command pane and it shows the corresponding source line.
Select a variable in the source pane and click the right mouse button. The current value is displayed. Arrays are displayed in the array inspection window. You can print these arrays to PostScript by using the Menu>Print Graph option.
You can view the contents of the register file, including general, floating-point, NaT, predicate, and application registers by selecting Registers from the Status menu. The Status menu also allows you to view stack traces or to switch OpenMP threads.


