This chapter describes several tools that you can use to monitor system performance. The tools are divided into two general categories: system monitoring tools and nonuniform memory access (NUMA) tools.
System monitoring tools include the hwinfo (1), topology(1), top(1) commands and the Performance Co-Pilot pmchart(1) commmand and other operating system commands such as the vmstat(1) , iostat(1) command and the sar(1) commands that can help you determine where system resources are being spent.
The gtopology(1) command displays a 3D scene of the system interconnect using the output from the topology(1) command.
You can use system utilities to better understand the usage and limits of your system. These utilities allow you to observe both overall system performance and single-performance execution characteristics. This section covers the following topics:
This section descibes hardware inventory and usage commands and covers the following topics:
The hwinfo (8) command is used to probe for the hardware present in the system. It can be used to generate a system overview log which can be later used for support. To see the version installed on your system, perform the following command:
% rpm -qf /usr/sbin/hwinfo hwinfo-12.55-0.3 |
For more information, see the hwinfo(8) man page.
The topology(1) command provides topology information about your system.
Applications programmers can use the topology command to help optimize execution layout for their applications. For more information, see the topology(1) man page.
| Note: The topology command is bundled with SGI ProPack for Linux. It is only available if you are running SGI ProPack on your system. |
Output from the topology command is similar to the following: (Note that the following output has been abbreviated.)
% topology
Machine parrot.americas.sgi.com has:
64 cpu's
32 memory nodes
8 routers
8 repeaterrouters

The cpus are:
cpu 0 is /dev/hw/module/001c07/slab/0/node/cpubus/0/a
cpu 1 is /dev/hw/module/001c07/slab/0/node/cpubus/0/c
cpu 2 is /dev/hw/module/001c07/slab/1/node/cpubus/0/a
cpu 3 is /dev/hw/module/001c07/slab/1/node/cpubus/0/c
cpu 4 is /dev/hw/module/001c10/slab/0/node/cpubus/0/a
                         ...
The nodes are:
node 0 is /dev/hw/module/001c07/slab/0/node
node 1 is /dev/hw/module/001c07/slab/1/node
node 2 is /dev/hw/module/001c10/slab/0/node
node 3 is /dev/hw/module/001c10/slab/1/node
node 4 is /dev/hw/module/001c17/slab/0/node
                        ...
The routers are:
/dev/hw/module/002r15/slab/0/router
/dev/hw/module/002r17/slab/0/router
/dev/hw/module/002r19/slab/0/router
/dev/hw/module/002r21/slab/0/router
                        ...
The repeaterrouters are:
/dev/hw/module/001r13/slab/0/repeaterrouter
/dev/hw/module/001r15/slab/0/repeaterrouter
/dev/hw/module/001r29/slab/0/repeaterrouter
/dev/hw/module/001r31/slab/0/repeaterrouter
                       ...
The topology is defined by:
/dev/hw/module/001c07/slab/0/node/link/1 is /dev/hw/module/001c07/slab/1/node
/dev/hw/module/001c07/slab/0/node/link/2 is /dev/hw/module/001r13/slab/0/repeaterrouter
/dev/hw/module/001c07/slab/1/node/link/1 is /dev/hw/module/001c07/slab/0/node
/dev/hw/module/001c07/slab/1/node/link/2 is /dev/hw/module/001r13/slab/0/repeaterrouter
/dev/hw/module/001c10/slab/0/node/link/1 is /dev/hw/module/001c10/slab/1/node
/dev/hw/module/001c10/slab/0/node/link/2 is /dev/hw/module/001r13/slab/0/repeaterrouter |
The gtopology(1) command is included as part of the pcp-sgi package of the SGI ProPack for Linux software. It displays a 3D scene of the system interconnect using the output from the topology(1) command. See the man page for more details.
| Note: The gtopology command is bundled with SGI ProPack for Linux. It is only available if you are running SGI ProPack on your system. |
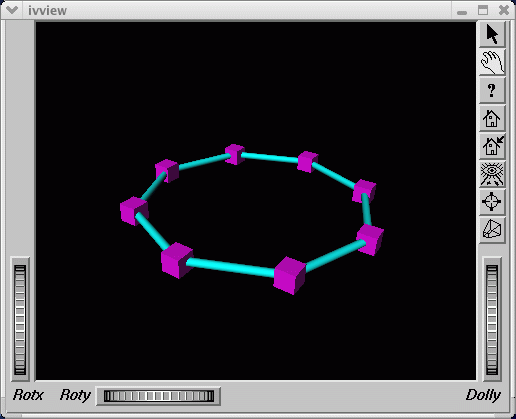
Figure 4-1, shows the ring topology (the eight nodes are shown in pink, the NUMAlink connections in cyan) of an Altix 350 system with 16 CPUs.
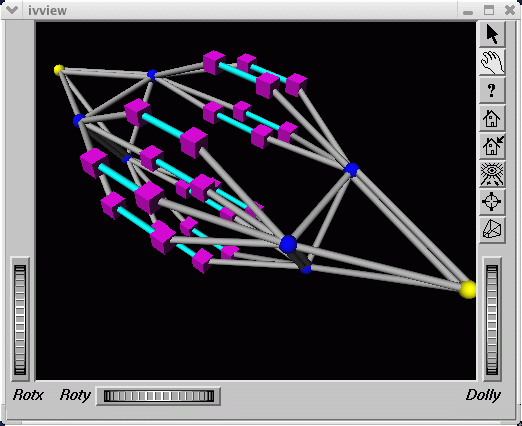
Figure 4-2, shows the fat-tree topology of an Altix 3700 system with 32 CPUs. Again, nodes are the pink cubes. Routers are shown as blue spheres (if all ports are used) otherwise, yellow.
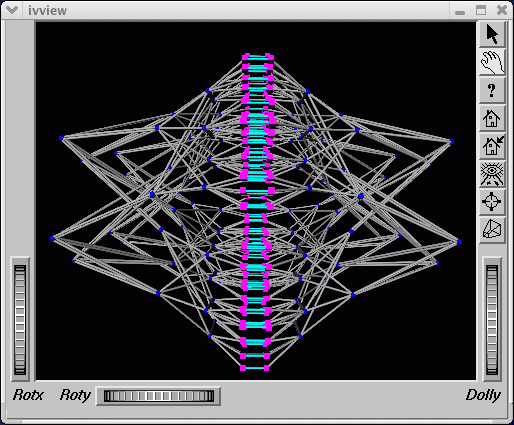
Figure 4-3, shows an Altix 3700 system with 512 CPUs. The dual planes of the fat-tree topology are clearly visible.
This section describes Performance Co-Pilot monitoring tools and covers the following topics:
| Note: pmshub(1), shubstats(1), and linkstat(1) are bundled with SGI ProPack for Linux. They are only available if you are running SGI ProPack on your system. |
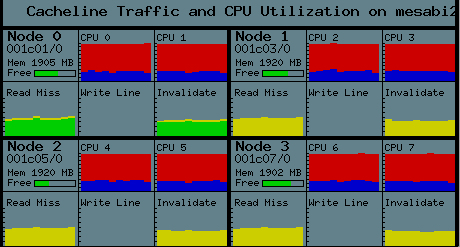
The pmshub(1) command is an Altix system-specific performance monitoring tool that displays ccNUMA architecture cacheline traffic, free memory, and CPU usage statistics on a per-node basis.
Figure 4-4, shows a four-node Altix 3700 system with eight CPUs. A key feature of pmshub is the ability to distinguish between local verses remote cacheline traffic statistics. This greatly helps you to diagnose whether the placement of threads on the CPUs in your system has been correctly tuned for memory locality (see the dplace(1) and taskset(1) man pages for information on thread placement.). It also shows undesirable anomalies such as hot cachelines (for example, due to lock contention) and other effects such as cacheline "ping-pong". For details about the intrepretation of each component of the pmshub display, see the pmshub(1) man page.
The shubstats(1) command is basically a command-line version of the pmshub(1) command (see “pmshub(1) Command”). Rather than showing a graphical display, the shubstats command allows you to measure absolute counts (or rate/time converted) ccNUMA-related cacheline traffic events, on a per-node basis. You can also use this tool to obtain per-node memory directory cache hit rates.
The linkstat(1) command is a command-line tool for monitoring NUMAlink traffic and error rates on SGI Altix systems. This tool shows packets and Mbytes sent/received on each NUMAlink in the system, as well as error rates. It is useful as a performance monitoring tool, as well as, a tool for helping you to diagnose and identify faulty hardware. For more information, see the linkstat(1) man page.
In addition to the Altix specific tools described above, the pcp and pcp-sgi packages also provide numerous other performance monitoring tools, both graphical and text-based. It is important to remember that all of the performance metrics displayed by any of the tools described in this chapter can also be monitored with other tools such as pmchart(1), pmval(1), pminfo(1) and others. Additionally, the pmlogger(1) command can be used to capture Performance Co-Pilot archives, which can then be "replayed" during a retrospective performance analysis.
A very brief description of other Performance Co-Pilot monitoring tools follows. See the associated man page for each tool for more details.
pmchart(1) -- graphical stripchart tool, chiefly used for investigative performance analysis.
pmgsys(1) -- graphical tool showing miniature CPU, Disk, Network, LoadAvg and memory/swap in a miniature display, for example, useful for permanent residence on your desktop for the servers you care about.
pmgcluster(1) -- pmgsys , but for multiple hosts and thus useful for monitoring a cluster of hosts or servers.
mpvis(1) -- 3D display of per-CPU usage.
clustervis(1) -- 3D display showing per-CPU and per-Network performance for multiple hosts.
nfsvis(1) -- 3D display showing NFS client/server traffic, grouped by NFS operation type
nodevis(1) -- 3D display showing per-node CPU and memory usage.
webvis(1) -- 3D display showing per-httpd traffic.
dkvis(1) - 3D display showing per-disk traffic, grouped by controller.
diskstat(1) -- command line tool for monitoring disk traffic.
topdisk(1) -- command line, curses-based tool, for monitoring disk traffic.
topsys(1) -- command line, curses-based tool, for monitoring processes making a large numbers of system calls or spending a large percentage of their execution time in system mode using assorted system time measures.
pmgxvm(1) -- miniature graphical display showing XVM volume topology and performance statistics.
osvis(1) -- 3D display showing assorted kernel and system statistics.
mpivis(1) -- 3D display for monitoring multithreaded MPI applications.
pmdumptext(1) -- command line tool for monitoring multiple performance metrics with a highly configurable output format. Therefore, it is a useful tools for scripted monitoring tasks.
pmval(1) -- command line tool, similar to pmdumptext(1), but less flexible.
pminfo(1) -- command line tool, useful for printing raw performance metric values and associated help text.
pmprobe(1) -- command line tool useful for scripted monitoring tasks.
pmie(1) -- a performance monitoring inference engine. This is a command line tool with an extraordinarily powerful underlying language. It can also be used as a system service for monitoring and reporting on all sorts of performance issues of interest.
pmieconf(1) -- command line tool for creating and customizing "canned" pmie(1) configurations.
pmlogger(1) -- command line tool for capturing Performance Co-Pilot performance metrics archives for replay with other tools.
pmlogger_daily(1) and pmlogger_check (1) -- cron driven infrastructure for automated logging with pmlogger(1).
pmcd(1) -- the Performance Co-Pilot metrics collector daemon
PCPIntro(1) -- introduction to Performance Co-Pilot monitoring tools, generic command line usage and environment variables
PMAPI(3) -- introduction to the Performance Co-Pilot API libraries for developing new performance monitoring tools
PMDA(3) -- introduction to the Performance Co-Pilot Metrics Domain Agent API, for developing new Performance Co-Pilot agents
Several commands can be used to determine user load, system usage, and active processes.
To determine the system load, use the uptime (1) command, as follows:
[user@profit user]# uptime 1:56pm up 11:07, 10 users, load average: 16.00, 18.14, 21.31 |
The output displays time of day, time since the last reboot, number of users on the system, and the average number of processes waiting to run.
To determine who is using the system and for what purpose, use the w(1) command, as follows:
[user@profit user]# w 1:53pm up 11:04, 10 users, load average: 16.09, 20.12, 22.55 USER TTY FROM LOGIN@ IDLE JCPU PCPU WHAT user1 pts/0 purzel.geneva.sg 2:52am 4:40m 0.23s 0.23s -tcsh user1 pts/1 purzel.geneva.sg 2:52am 4:29m 0.34s 0.34s -tcsh user2 pts/2 faddeev.sgi.co.j 6:03am 1:18m 20:43m 0.02s mpirun -np 16 dplace -s1 -c0-15 /tmp/ggg/GSC_TEST/cyana-2.0.17 user3 pts/3 whitecity.readin 4:04am 9:48m 0.02s 0.02s -csh user2 pts/4 faddeev.sgi.co.j 10:38am 2:00m 0.04s 0.04s -tcsh user2 pts/5 faddeev.sgi.co.j 6:27am 7:19m 0.36s 0.32s tail -f log user2 pts/6 faddeev.sgi.co.j 7:57am 1:22m 25.95s 25.89s top user1 pts/7 mtv-vpn-hw-richt 11:46am 39:21 11.20s 11.04s top user1 pts/8 mtv-vpn-hw-richt 11:46am 33:32 0.22s 0.22s -tcsh user pts/9 machine007.americas 1:52pm 0.00s 0.03s 0.01s w |
The output from this command shows who is on the system, the duration of user sessions, processor usage by user, and currently executing user commands.
To determine active processes, use the ps(1) command, which displays a snapshot of the process table. The ps -A command selects all the processes currently running on a system as follows:
[user@profit user]# ps -A
  PID TTY          TIME CMD
    1 ?        00:00:06 init
    2 ?        00:00:00 migration/0
    3 ?        00:00:00 migration/1
    4 ?        00:00:00 migration/2
    5 ?        00:00:00 migration/3
    6 ?        00:00:00 migration/4
                    ...
 1086 ?        00:00:00 sshd
 1120 ?        00:00:00 xinetd
 1138 ?        00:00:05 ntpd
 1171 ?        00:00:00 arrayd
 1363 ?        00:00:01 amd
 1420 ?        00:00:00 crond
 1490 ?        00:00:00 xfs
 1505 ?        00:00:00 sesdaemon
 1535 ?        00:00:01 sesdaemon
 1536 ?        00:00:00 sesdaemon
 1538 ?        00:00:00 sesdaemon
|
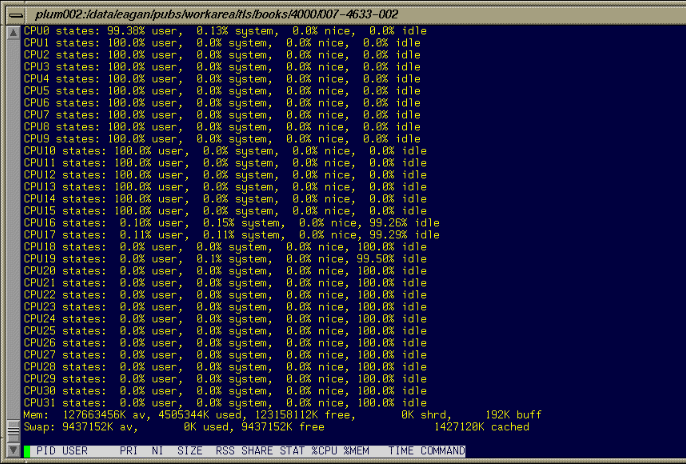
To monitor running processes, use the top (1) command. This command displays a sorted list of top CPU utilization processes as shown in Figure 4-5.
The vmstat(1) command reports virtual memory statistics. It reports information about processes, memory, paging, block IO, traps, and CPU activity. For more information, see the vmstat(1) man page.
[user@machine3 user]# vmstat procs memory swap io system cpu r b swpd free buff cache si so bi bo in cs us sy id wa 1 0 0 81174720 80 11861232 0 0 0 1 1 1 0 0 0 0 |
The first report produced gives averages since the last reboot. Additional reports give information on a sampling period of length delay. The process and memory reports are instantaneous in either case.
The iostat(1) command is used for monitoring system input/output device loading by observing the time the devices are active in relation to their average transfer rates. The iostat command generates reports that can be used to change system configuration to better balance the input/output load between physical disks. For more information, see the iostat(1) man page.
user@machine3 user]# iostat
Linux 2.4.21-sgi302c19 (revenue3.engr.sgi.com)  11/04/2004

avg-cpu:  %user   %nice    %sys   %idle
          40.46    0.00    0.16   59.39

Device:            tps   Blk_read/s   Blk_wrtn/s   Blk_read   Blk_wrtn
|
The sar(1) command writes to standard output the contents of selected cumulative activity counters in the operating system. The accounting system, based on the values in the count and interval parameters, writes information the specified number of times spaced at the specified intervals in seconds. For more information, see the sar(1) man page.
[user@machine3 user]# sar Linux 2.4.21-sgi302c19 (revenue3.engr.sgi.com) 11/04/2004 12:00:00 AM CPU %user %nice %system %idle 12:10:00 AM all 49.85 0.00 0.19 49.97 12:20:00 AM all 49.85 0.00 0.19 49.97 12:30:00 AM all 49.85 0.00 0.18 49.97 12:40:00 AM all 49.88 0.00 0.16 49.97 12:50:00 AM all 49.88 0.00 0.15 49.97 01:00:00 AM all 49.88 0.00 0.15 49.97 01:10:00 AM all 49.91 0.00 0.13 49.97 01:20:00 AM all 49.88 0.00 0.15 49.97 01:30:00 AM all 49.88 0.00 0.16 49.97 01:40:00 AM all 49.91 0.00 0.13 49.97 01:50:00 AM all 49.87 0.00 0.16 49.97 02:00:00 AM all 49.91 0.00 0.13 49.97 02:10:00 AM all 49.91 0.00 0.13 49.97 02:20:00 AM all 49.90 0.00 0.13 49.97 02:30:00 AM all 49.90 0.00 0.13 49.97 02:40:00 AM all 49.90 0.00 0.13 49.97 02:50:00 AM all 49.90 0.00 0.14 49.96 03:00:00 AM all 49.90 0.00 0.13 49.97 03:10:00 AM all 49.90 0.00 0.13 49.97 03:20:00 AM all 49.90 0.00 0.14 49.97 03:30:01 AM all 49.89 0.00 0.14 49.97 03:40:00 AM all 49.90 0.00 0.14 49.96 03:50:01 AM all 49.90 0.00 0.14 49.96 04:00:00 AM all 49.89 0.00 0.14 49.97 04:10:00 AM all 50.18 0.01 0.66 49.14 04:20:00 AM all 49.90 0.00 0.14 49.96 04:30:00 AM all 49.90 0.00 0.14 49.96 04:40:00 AM all 49.94 0.00 0.10 49.96 04:50:00 AM all 49.89 0.00 0.15 49.96 05:00:00 AM all 49.94 0.00 0.09 49.97 05:10:00 AM all 49.89 0.00 0.16 49.96 05:20:00 AM all 49.94 0.00 0.10 49.96 05:30:00 AM all 49.89 0.00 0.16 49.96 05:40:00 AM all 49.94 0.00 0.10 49.96 05:50:00 AM all 49.93 0.00 0.11 49.96 06:00:00 AM all 49.89 0.00 0.15 49.96 06:10:00 AM all 49.94 0.00 0.10 49.96 06:20:01 AM all 49.88 0.00 0.17 49.95 06:30:00 AM all 49.93 0.00 0.10 49.96 06:40:01 AM all 49.93 0.00 0.11 49.96 06:50:00 AM all 49.88 0.00 0.16 49.96 07:00:00 AM all 49.93 0.00 0.10 49.96 07:10:00 AM all 49.93 0.00 0.11 49.96 07:20:00 AM all 49.87 0.00 0.17 49.96 07:30:00 AM all 49.99 0.00 0.13 49.88 07:40:00 AM all 50.68 0.00 0.14 49.18 07:50:00 AM all 49.94 0.00 0.11 49.94 08:00:00 AM all 49.92 0.00 0.13 49.94 08:10:00 AM all 49.88 0.00 0.18 49.95 08:20:00 AM all 49.93 0.00 0.13 49.95 08:30:00 AM all 49.93 0.00 0.12 49.95 08:40:00 AM all 49.93 0.00 0.12 49.95 08:50:00 AM all 25.33 0.00 0.08 74.59 09:00:00 AM all 0.02 0.00 0.04 99.95 09:10:00 AM all 1.52 0.00 0.05 98.43 09:20:00 AM all 0.41 0.00 0.10 99.49 09:30:00 AM all 0.01 0.00 0.02 99.97 09:40:00 AM all 0.01 0.00 0.02 99.97 09:50:00 AM all 0.01 0.00 0.02 99.97 10:00:00 AM all 0.01 0.00 0.02 99.97 10:10:00 AM all 0.01 0.00 0.08 99.91 10:20:00 AM all 2.93 0.00 0.55 96.52 10:30:00 AM all 3.13 0.00 0.02 96.84 10:30:00 AM CPU %user %nice %system %idle 10:40:00 AM all 3.13 0.00 0.03 96.84 10:50:01 AM all 3.13 0.00 0.03 96.84 Average: all 40.55 0.00 0.13 59.32 |
